
Recording Level and Tape MOL
The decisive step in recording is setting the recording level. If it is too high, we exceed the tape’s capability (MOL), and the sound immediately begins to distort. Conversely, if the level is too low, the music’s pianissimo passages will be submerged in tape noise. In other words, setting the recording level so that the tape does not distort and its noise is not noticeable is an important recording technique.
We determine the level by watching the deck’s meter, but, as we will explain in the next section, decks have several types of meter. The needle or LEDs may appear to indicate the same thing while the level actually recorded on the tape is quite different. So the secrets of setting the level cannot simply be explained in a few words.
Therefore, although this is a small detour, let’s take a good look at the relationship between music and tape capability (MOL). This may help you learn more quickly how to use your favorite tapes freely and confidently. Recalling what we previously discussed about music, tone and frequency response, let’s now examine recording level.
A Spectrum Analyzer Breaks Music Down into Its Components and Shows Them to Us
Recall a time when the recording level was too high and we drove the tape into distortion. If the vocals and bass are distorted beyond repair, anyone can understand that the recording level was too high. But a less attentive listener may not notice distortion that merely makes the sound seem somehow dull and the high frequencies less clear.
This depends on precisely where the music’s energy exceeded the tape’s MOL. What makes up the “body” of music is mainly in the mid-low frequencies.
For example, strike the highest piano note, the key furthest to the right, and we hear a very high, ringing sound. Yet the frequency underlying this sound, its fundamental, is just above 4 kHz - surprisingly low. Higher harmonic components, or overtones, at two, three, four… n times the fundamental frequency are added, and we hear the piano’s characteristic tone.
What we called “distortion beyond repair” above results from exceeding the tape’s MOL in the range that forms the “body” of the music. In the second case, where a recording somehow lacks sparkle, MOL is most often exceeded in the range of the harmonics. Even if the main component is recorded reliably, distortion of the harmonic components corrupts the information conveying tone and nuance, and the sound loses its clarity.
We would therefore like to know how and at what levels harmonic components occur in music. Let’s investigate with a spectrum analyzer.
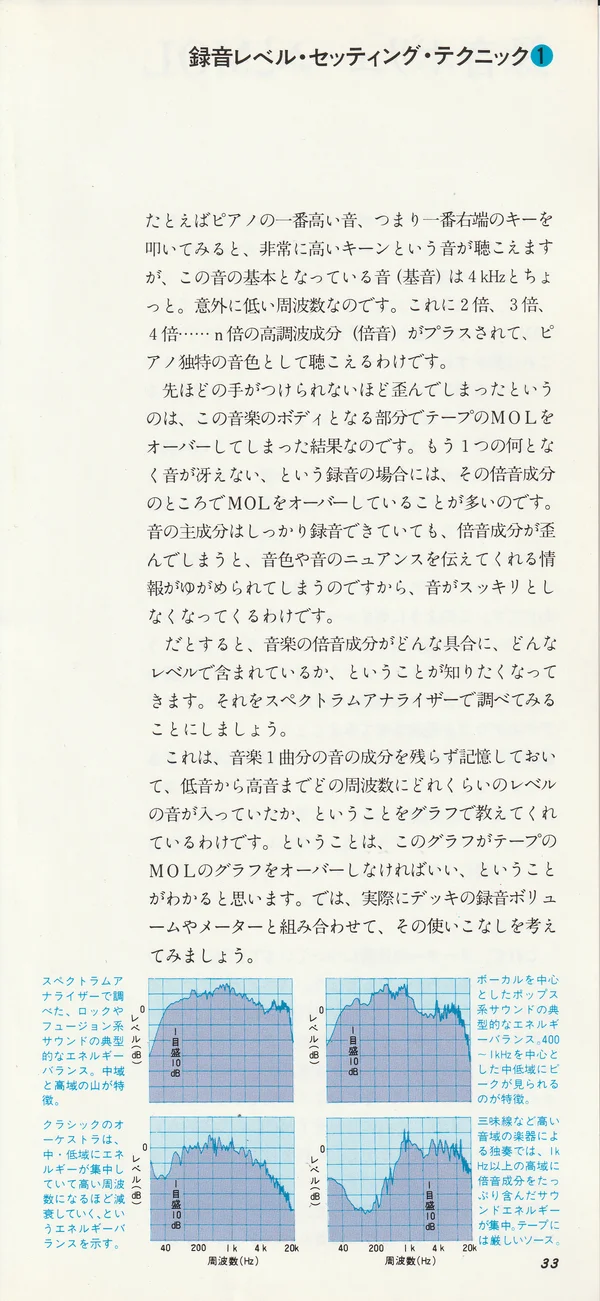
This device stores all the sound components of a musical piece and displays a graph showing the signal levels present at frequencies from low to high. All we need to understand is that this graph must not exceed the tape’s MOL curve. Now let’s consider how to use the graph together with the recording level control and the deck’s meter.
Captions under the four spectra on page 33 of the handbook, showing typical energy balances of different genres examined with a spectrum analyzer:
Rock and fusion: peaks in the mid and high frequencies are characteristic.
Classical orchestra: energy is concentrated in the mid-low frequencies and falls as frequency rises.
Vocal pop: a peak in the mid-low range centered around 400 Hz-1 kHz is characteristic.
High-register solo instruments, such as shamisen: sound energy with extensive harmonic components is concentrated above 1 kHz. This is a demanding source for tape.
Recording Level Control and MOL
If we overlay the spectrum analyzer graph on the MOL curve, we can immediately see where the music is most likely to exceed the tape’s MOL. How do we use this?
MOL is the limit of the tape’s capability and must not be exceeded. The spectrum analyzer graph, however, represents the music itself. We can freely change its level with the recording level control.
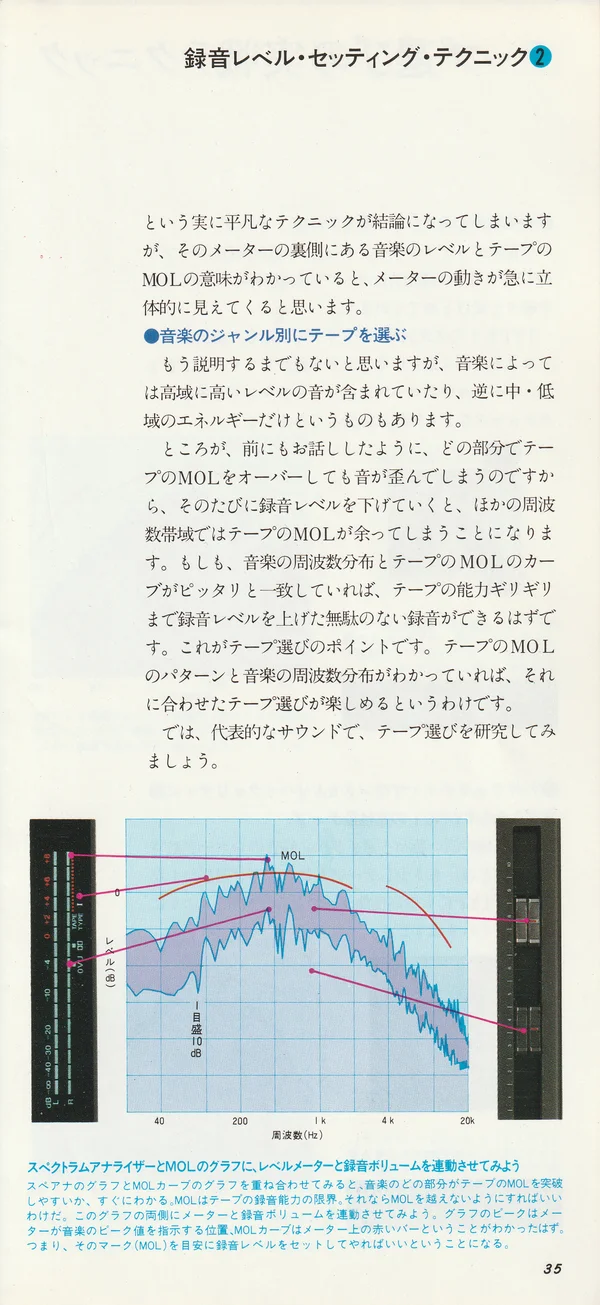
To make this visible, let’s place the spectrum analyzer graph and MOL curve alongside the recording level control and deck meter. On a slider, recording level rises as it moves to the right, but here we will draw it rising upward for clarity. This aligns the spectrum analyzer’s position with the level of the MOL curve. The deck meter’s deflection changes with the recording level control, so let’s relate it to the spectrum analyzer graph too.
Setting the Recording Level So MOL Is Not Exceeded
We can then see that the spectrum analyzer graph and the level meter have a very similar relationship. The graph shows the music level divided by frequency, while the meter shows the same thing as one combined value. That is the only difference.
The meaning of markings such as TYPE I on the meter scale should now be clearer. Like the MOL curve on the spectrum graph, they show a characteristic MOL level for that tape type. The meter scale cannot show MOL at every frequency, so it carries a characteristic MOL level for each tape, serving as a representative MOL level across all frequencies.
Raise the recording level control and set it so the meter needle does not pass the MOL mark: the technique is almost embarrassingly simple. But if you understand what lies behind the meter - the music level and the tape’s MOL - the needle’s movement becomes much more meaningful.
Choosing Tape for the Music Genre
This may hardly need saying, but some music contains strong high-frequency signals, while other music has energy only in the mid-low range.
As we said earlier, if the tape’s MOL is exceeded in any range, the sound distorts. If the recording level must be lowered each time, the tape’s MOL in the other frequency ranges remains underused.
If the music’s frequency distribution exactly matched the tape’s MOL curve, the recording level could be raised right to the limit of the tape’s capability for a recording without loss.
That is the essence of choosing tape. If you know the shape of the tape’s MOL curve and the music’s frequency distribution, choosing a suitable tape becomes a pleasure.
Caption for the diagram on page 35:
Connect the spectrum analyzer and MOL curve with the level meter and recording level control. Overlaying the analyzer graph on the MOL curve immediately shows where the music is most likely to exceed the tape’s MOL. MOL is the limit of the tape’s recording capability, so all you need to do is stay below it. Place the meter and recording level control on either side of this graph. It should become clear that the peak of the graph is the position where the meter shows the music’s peak value, and that the MOL curve corresponds to the red band on the meter scale. In other words, use that mark (MOL) to set the recording level.
Practical Tape Selection
Let’s use examples of characteristic sounds to see how to choose tape.
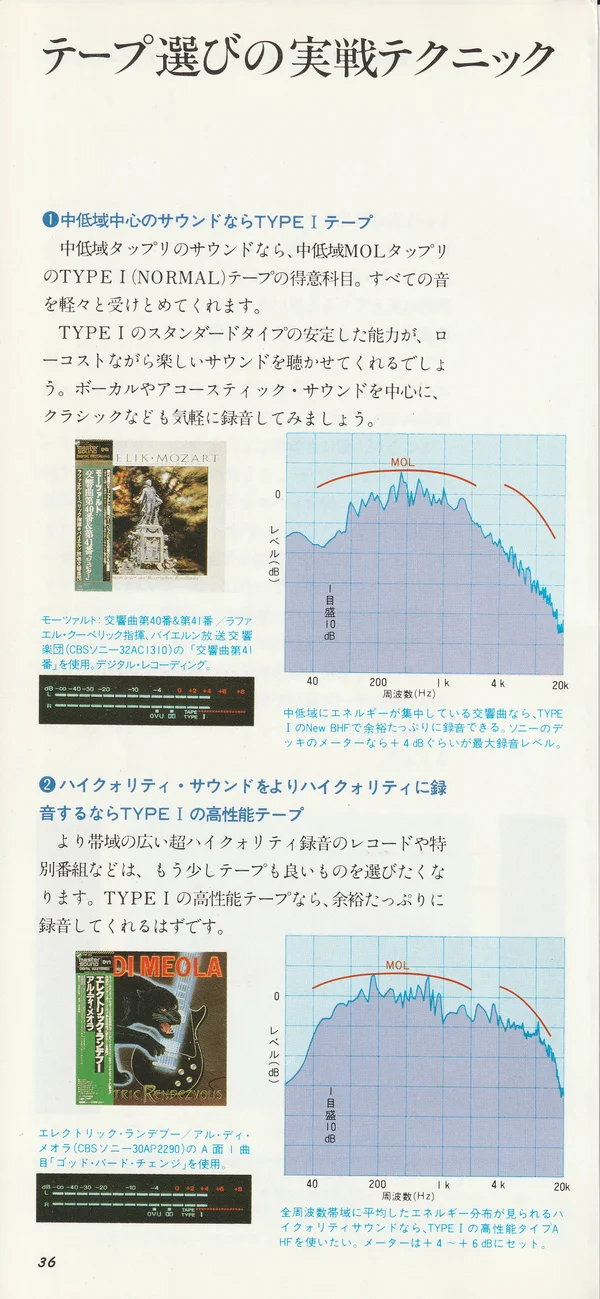
❶ For Mid-Low Emphasis: TYPE I Tapes
TYPE I (NORMAL) tapes, with generous MOL in the mid-low range, are in their element with sounds rich in those frequencies. They will easily accommodate all kinds of sound.
The consistent performance of standard TYPE I tape offers inexpensive but pleasant sound. Feel free to record vocals, acoustic sound and classical music on it.
Recording example: “Symphony No. 41” from “Mozart: Symphonies Nos. 40 and 41” / conductor Rafael Kubelík, Bavarian Radio Symphony Orchestra (CBS/Sony 32AC1310). Digital recording.
The energy is visibly concentrated in the mid-low frequencies. TYPE I New BHF has headroom to spare; the deck’s meter does not even reach its limit.
❷ To Record High-Quality Sound Even Better: High-Quality TYPE I Tapes
For wider-range recordings, exceptionally high-quality discs or special broadcasts, you will want better tape too. High-quality TYPE I tapes record this material with plenty of headroom.
Recording example: “God Bird Change”, the first track on side A of “Electric Rendezvous” / Al Di Meola (CBS/Sony 30AP2290).
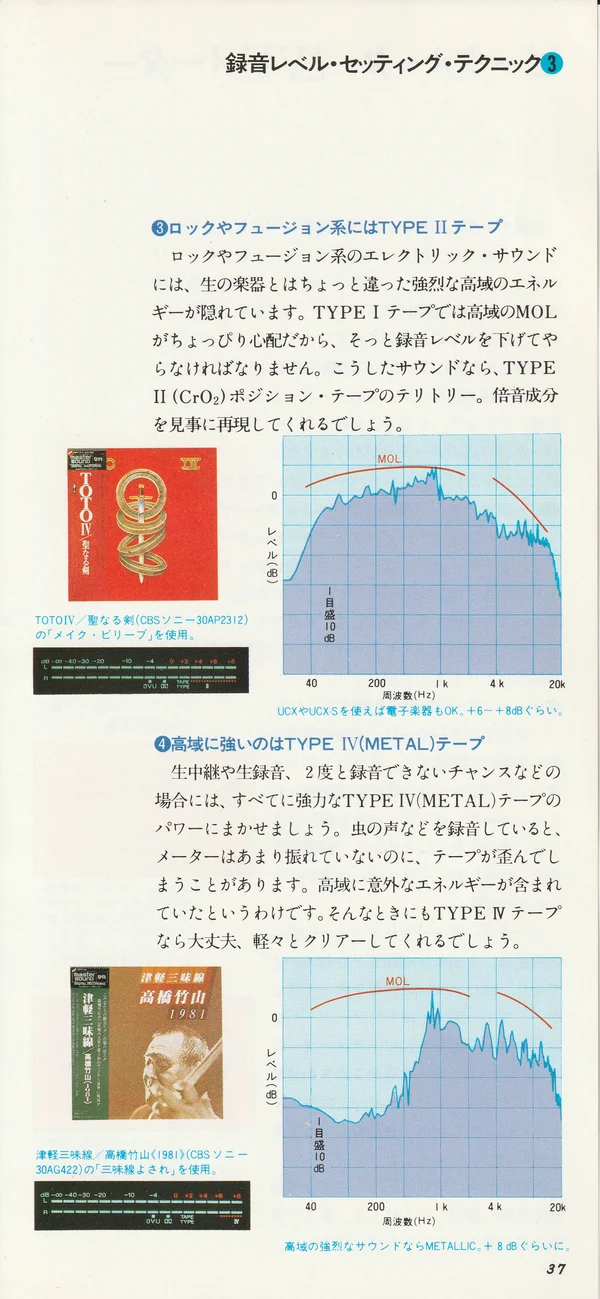
❸ For Rock and Fusion: TYPE II Tapes
The electric sound of rock and fusion contains powerful high-frequency energy unlike that of live acoustic instruments. With TYPE I tape, high-frequency MOL is a slight concern, so the recording level must be lowered carefully. This is the territory of TYPE II (CrO₂) position tapes. They reproduce harmonic components beautifully.
Recording example: TOTO IV, “Holy Sword” / Sony 59HFD15 / level: 0 dB.
Rock and fusion sounds, as the name suggests, have many strong high-frequency components.
❹ Strongest at High Frequencies: TYPE IV (METAL) Tapes
For live broadcasts, live recordings and other situations where a second recording is impossible, rely on the power of TYPE IV (METAL) tapes. When recording insect sounds, the level meter may barely move while the tape still distorts: there is unexpectedly much energy at high frequencies. In such cases TYPE IV is fine - it handles them easily.
Recording example: “Shamisen Yosare” from “Tsugaru Shamisen” / Chikuzan Takahashi (1981) (CBS/Sony 30AG422).
For sound with a powerful high-frequency component: METALLIC, at approximately +8 dB.
Peak Meters and VU Meters
To set the recording level correctly, a meter is indispensable. But meters come in different types, differing not only in the movement of the needle but also in the level represented by “0” on the scale, so considerable knowledge is needed to read them properly.
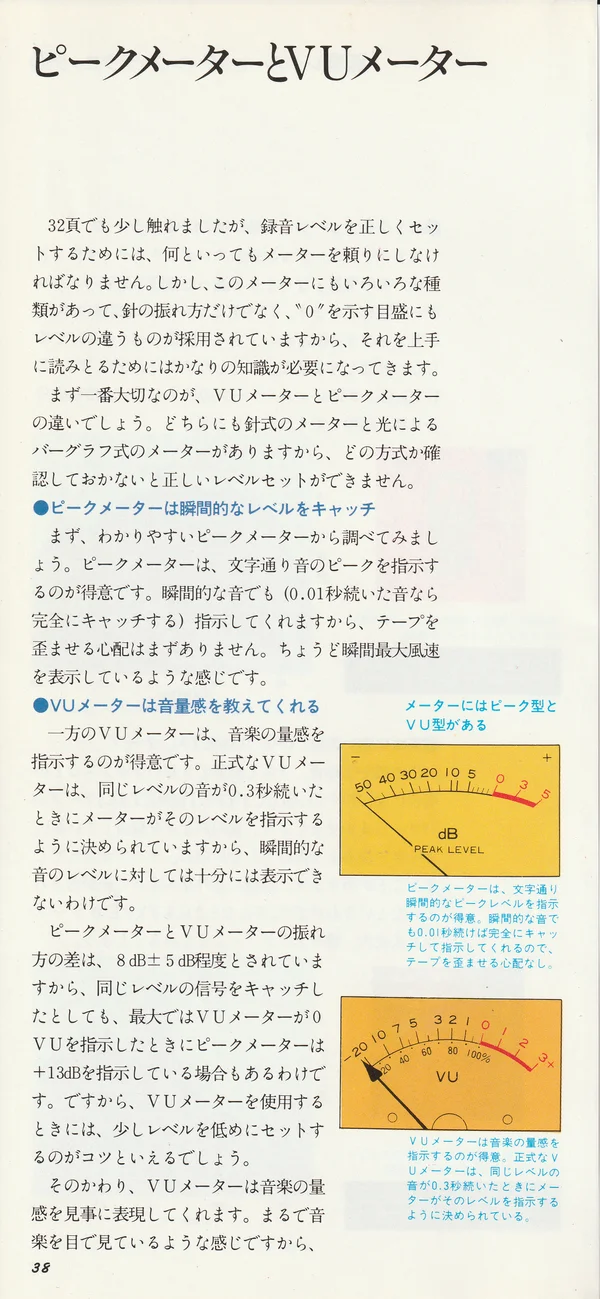
The most important distinction is between the VU meter and the peak meter. Both can have needles or LED bar-graph displays, so you cannot set the level correctly without first checking which type you have.
Peak Meters Catch Instantaneous Levels
Let’s start with the peak meter, which is easier to understand. As its name suggests, it excels at showing sound peaks. It displays even instantaneous signals, fully capturing a sound lasting 0.01 seconds, so there is almost no concern about tape distortion. It is like an instrument showing the instantaneous maximum wind speed.
VU Meters Convey the Sense of Sound Volume
A VU meter excels at showing the fullness of sound. A proper VU meter is designed to show the signal level when a signal at that level lasts 0.3 seconds, so it cannot fully show instantaneous sound levels.
The difference in deflection between a peak meter and a VU meter is considered to be about 8 dB ± 5 dB. Thus, for the same signal, a VU meter may show 0 VU while a peak meter shows a maximum of +13 dB. The trick when using a VU meter is therefore to leave a little headroom.
In return, the VU meter conveys the fullness of sound beautifully. It is like seeing the music with your eyes, making it a very convenient meter both for matching left and right channels and for checking overall balance. No wonder it is becoming increasingly popular with professionals.
Peak Meters Are More Convenient for Tape Enthusiasts
Although both are excellent meters, we recommend a peak meter to tape enthusiasts. Even an instantaneous excess level is harmful to tape, so a peak meter that can capture it accurately allows more confident recording. A peak meter with a Peak Hold function, which holds the peak level for several seconds, is also highly readable.
Pay Attention to the Meter Scale
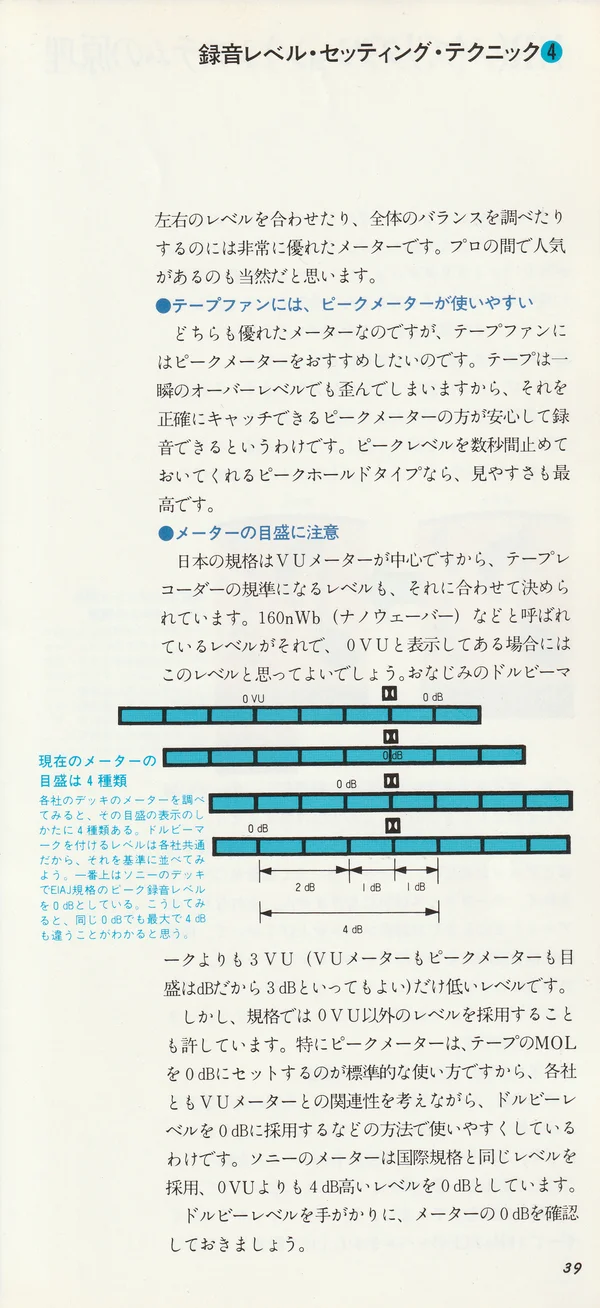
The Japanese standard is built mainly around the VU meter, so the reference level for tape recorders is also set for it. The level called 160 nWb (nanowebers) is that reference; if the scale says 0 VU, you can assume it means this level. It is 3 VU below the familiar Dolby level (since both VU and peak meter scales are in dB, this can also be called 3 dB).
However, the standard also allows levels other than 0 VU. In particular, the standard for a peak meter is to set the tape’s MOL at 0 dB, so manufacturers take the relationship with the VU meter into account and make the scale more convenient, for example by taking Dolby level as 0 dB. Sony meters use the same level as the international standard: 0 dB is the level 4 dB above 0 VU.
Using the Dolby level as a reference, check 0 dB on your meter’s scale.
Caption for the diagram on page 39:
Today there are four kinds of meter scale. If you examine decks from different manufacturers, you will find four ways of marking the scale. The level marked Dolby is common to all, so let us use it as a reference and place the scales side by side. At the top is a Sony deck meter, where 0 dB is the EIAJ standard peak recording level. You can see that the same 0 dB differs by up to 4 dB between manufacturers.